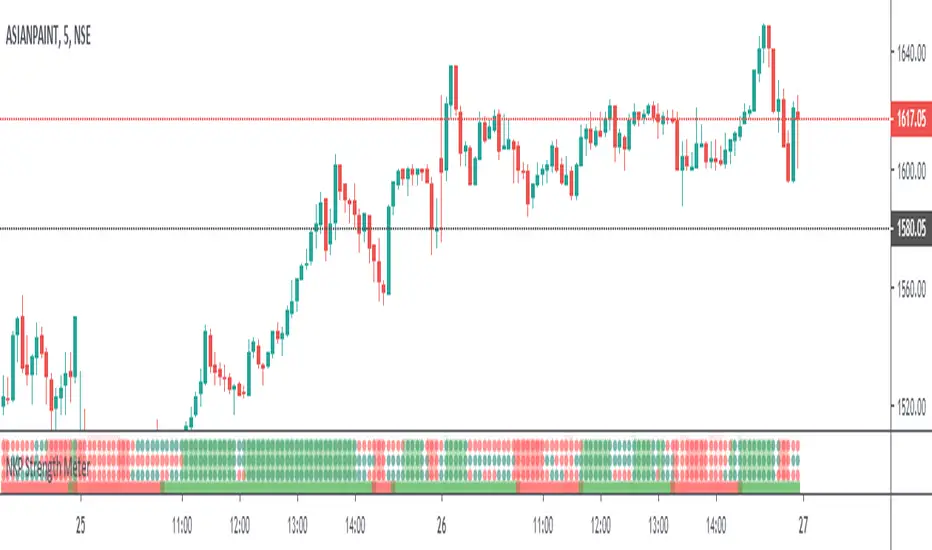
NKP Strength MeterNKP Strength Meter is an indicator it will show the strength of the trend based on built-ins indicators like RSI , MACD , ADX , PSAR and some mathematical formulas. we can apply in any time frame. it is dynamically calculate the values based which time frame user got selected. By using this we can trend strength, read on. ( we can apply this in any time frame chart)
NKP Strength Meter has 3 main components:
one trend bar - it will plot only in two colors either Green or Red. Green indicates buy strength Red indicates sell strength.
three trend dotted lines - these also will plot only in two color either Red or Green. Green indicates buy strength Red indicates sell strength.
color plotted area - if all are in the Green it will plot the green background. all are in red it will plot the red background based these we can easily identify the strength of the trend while seeing the chart.
How does it work?
If all trend bar and dotted lines are green it means buyers strength is more.(continue with uptrend)
If all trend bar and dotted lines are red it means seller strength is more.(continue with downtrend)
mixed colors on dotted line and trend bar there is strength at that time.
What are the signals?
it wont generate any signals. just it will plot the strength dotted lines and trend bar it identify the strength of the trend.
Can we set the Alert on this?
No, it will use to see the strength of the trend while taking the order.(just for trend confirmation)
IMPORTANT: this script does not generate any signals. Perfectly catches long runs in trends at all underlings (stocks, indexes ) at any time frame.
Try it! Good luck and good trading!
For access, please PM us or visit the link below in our Signature.
在腳本中搜尋"RSI MACD"
CuandoCrypto's Swing Trade IndicatorThis indicator combines RSI, MACD, Williams %R and Z-Score to determine if there's a high probability of an imminent trend reversal. This indicator is best used on higher timeframes.
The 1h Wick Wicky - Bitcoin BeatsThis script Uses a bunch of different indicators in order to catch wicks.
Included are:
SAR
JME
Range Filter
ADX
RSI
MACD
Automatic Plotted TP
Unconfirmed entries followed by confirmed entries
This is a combination of different indicators therefore the credit shall not go to me but I have changed certain parameters in order to benefit backtesting profitability.
Trade at your own risk!

Epic Market Indicator 3.0 (EMI 1)After months and months of back-testing, I have finally decided to release this update. I would also like to give out a special thanks to Tradingview for making it possible to create indicators and share this with the community. I have occurred a lot of information in this community. I believe that when you take, you should also share. That’s why I am sharing this wonderful indicator for free. Remember, knowledge and experience is the most valuable things in life.
EMI, Epic Market Indicator:
60-74% theoretically profitable trades, depending on the time period. However if you use EMI blindly, the percentage might even go lower. Nevertheless, there should be enough presenting opportunities, if you use her wisely.
Like in the movie Inception, the deeper and longer you thread into dream within a dream etc., the more dangerous or riskier it becomes. It is recommended to use EMI on 15 min. charts and above. I do not recommend using EMI on altcoin markets.
Tip: People = Psychology > Patterns > Indicators. They are all important nonetheless and explicitly keep this order in the back of your mind when using EMI.
EMI 1 is actually a combination of diverse indicators such as EMA, SMA, Pivots etc. I have turned of certain indicators by default, those I do not need to see most of the time:
- Tesla EMA Ribbon: Periods based upon Nikola Tesla's favorite numbers, 3, 6, 9. (Enabled by default)
- Fibonacci EMA Ribbon: Periods based upon Fibonacci frequency; 13, 21, 55, 89. (Enabled by default)
- Pivots (Disabled by default).
-Bollinger bands (Disabled by default).
- SMA 100 & 200 (Disabled by default).
- Bar trend color: red = bearish & green = bullish (Disabled by default).
-Buy & Sell signals, which makes EMI a unique indicator: Based upon diverse indicators & oscillators. Not predictions, but high probabilities. (Enabled by default, obviously ^^ )
Red symbols are sell or short signals / Green symbols are buy or long signals.
Dots represents possible price action trend reversals and the diamond symbols could be a possible confirmation and the big X is even a stronger confirmation signal. (A top or bottom, not THE bottom or top). These signals are based upon certain buy & sell conditions by a diversity of indicators known by most traders. Think for example, crossing EMA’s, Stochastic RSI, MACD, oversold and overbought territories.
ALWAYS wait for the candle to close and another confirmations before taking any consideration nor actions. No signals means trend continuation.
Using EMI1 in combination with EMI 2, traditional authentic patterns and darkened theme is recommended. Good luck fellow traders and don't forget to smash that like button! Thanks in advance.

BITCOIN_BUYSELL_vs_DOMINANCEUpdated to three lines similar to the 20, 50, 200 ema however they utilize RSI + MACD + EMA + ROC + Averaging powers to generate buy and selling zones

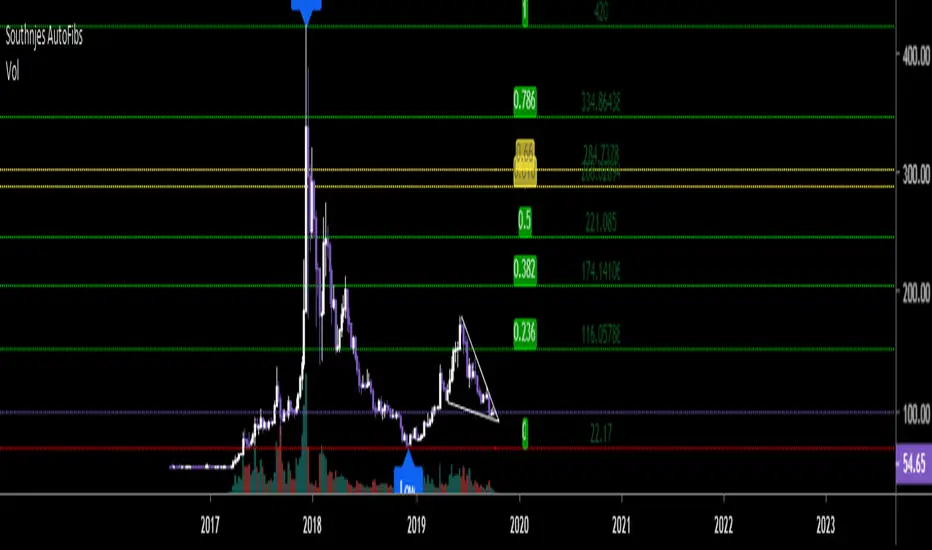
Southnjes - Auto Fibonacci LevelsI obtained this script elsewhere and modified it. Original Script by "borserman". Thank you for this.
I added some extras that he did not have, hence the uploaded and modified version.
I tried to add this to my "Southnjes- Multi 5MA/5EMA crossover signal + RSI/MACD/STOCH Div signal + Bollinger + Candlestick signals." But there were too many outputs so it had to go separate.
Anyway. You can change the "Fib period" to get the positions you need on the levels. Default is 100 but I will change mine to 25/50/200 and sometimes 180 or 220 which gives me my needed highs and lows for calculations. Play with it as it only takes a minute or so to get the desired H/L.
Golden pocket is mapped in golden.
Green is up, Red is down.
Higher Fib levels can be turned off or on (1.272-3.618).
I hope you all enjoy it and again, don't forget to visit borserman for his other great scripts. :)
QuantCat Mom Finder Strategy (1H)QuantCat Momentum Finder Strategy
This strategy is designed to be used on the 1 hour time frame, on all x/btc pairs.
The beautiful thing is it plots the take profit, and stoploss for you for each entry- where I would say use the stoploss for sure and feel with water with how the price action is looking when in profit.
In this strategy, I actually implemented my own trading style into building the strategy. Having to replicate my own trading strategy into an algorithm, I can't make it exactly perfect to how I would trade, but what I can do is try and program the parameters that give it the absolute best chance of making a big move with a small drawdown- which replicates part of my momentum trading style. Here I am using RSI, MACD, EMA and trend filtering values to find moments where there has been a momentum change to play the rest of the move. It only picks the best entries.
There is always a 3-4 R/R move on average with with these trades, meaning 1 in 4 only need to hit to be a break even trader- where most of these strategies have about 35% hit rate.
The stoploss is so crucial to minimise any damage from huge unexpected candles, the strategies can just be used for entries as well, you don't have to stick to the exact formula- of the long and short system, but this by itself is profitable.
The system nets positive results on
-ETH/BTC
-LTC/BTC
-XRP/BTC
-ADA/BTC
-NEO/BTC etc.
We also have a free 15M strategy available too.
You can join our discord server to get live alerts for the strategy as well as speak to our devs! Link in signature below!!!

Helios - by @cryptomrdavis -
Helios is a simple to use oscillator.
It represent the state of different indicators at the moment. If you see a small green column, that means that only one or few indicators are getting into the positiv area, wait for higher bars to get into a trade. Same thing on the red bars side.
Calculation is based on few indicators like RSI , MACD , EMA , SMA and some more.
Happy trading
+++ use this tool on your own risk. i'm not responsible for your loses +++
Show some ❤
____________________________________________________________________________
BTC: 1GVRDK3HHr9CKM5SF2CGpCNXFuavB3L4j9
ETH: 0x7b825fa752b9926D3E8397cDb1d9E5473D074646
XMR: 41zL2SQS7zyZmwXKng2TeUWsMi5vMmkgSdDCjULUTvM6ichwm1E2ZDEYGt56zk9ghoM9bekhjycSwa8amtTcB2JiUet5jtg
NEO: AXja5xPDhczfm2ujHyBfpkQAAnMsXsazmb
ZEC: zcZzFkRx95cp7MtuW8wLhC5zz5RYF9QkT2uPPmhZZHc6ppXepHGgCSeAS1rtD6WFdqsM5p1gZm2gfirnrnviucsdP4aCpqU
XLM: GAXUQJSW55C7MAC4GI26NZUGIKSHFDVFRFKZCXPLMPY4HCADSDT55XK6
WAVES: 3PCMkNpMHxSraTCkwV1ENcBKa9sXbVCGjQX
BCH: qz57n04ud6mn42u00aymqkku8tfh0lk4jv9c28mjvv
____________________________________________________________________________
++++ cryptotradingresource.com ++++
____________________________________________________________________________

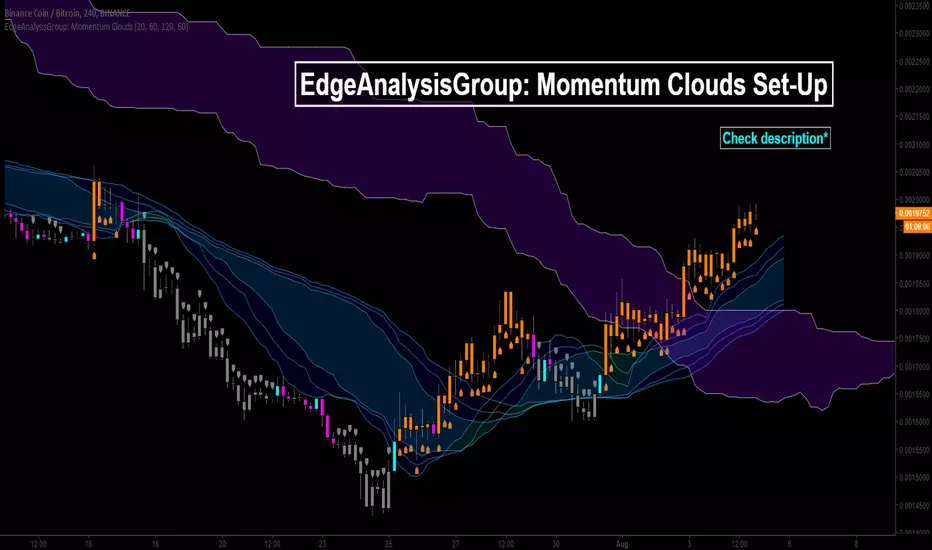
EdgeAnalysisGroup: Momentum Clouds Set-UpWhat do you need turned off and on in the settings to have this exact setup?
Bar colours transparency = 100%
Lagging Span off
Baseline off
Conversion line off
What is it?
This trading strategy is an all in one. This means any additional parameters could make the set-up very noisy. I spent hours developing and back-testing the core of the whole method- volume clouds. The volume cloud is the wavey/much more fluid centralised cloud. These have in essence been left the same with new additions crafted around the volume clouds, the ichi and the momentum indicator. It Uses-
Volume
MA's
Ichimoku Clouds
Displacement
RSI
MACD
Even though your fundamental price action will come into play when using this indicator- it does abstract resistance/support zones and trade zones very nicely to make the overall difficulty of the indicator and trading experience much lesser.
How to trade on it?
Trade edge to edge on the clouds.
Mid-section is safe trade area on volume cloud.
Trade re-tests / rejections. Watching for 3rd retest + for break back into cloud.
Bullish mom + break above vol cloud = Bullish trend.
Bearish mom + break below vol cloud = Bearish trend.
Stoploss is situational.
Example board:
BTC/USD 1 Day.
ETH/BTC 1 Day.
NEO/BTC 4 Hour.
Hopefully from these examples, when observing them you are understanding how the clouds work, and how the momentum ties into the whole model, any questions don't hesistant to comment- and feel free to drop me a follow for my hard work too.
Thank you for reading, I hope this indicator can aid you, as it is doing with a few of my friends and myself.
All information found here, including any ideas, opinions, scripts, views, predictions, forecasts, commentaries, suggestions, or stock/cryptocurrency picks, expressed or implied herein, are for informational, entertainment or educational purposes only and should not be construed as personal investment advice. These are not facts but my personal views and opinions.
I will not and cannot be held liable for any actions you take as a result of anything you read here.

Looney's Forex Buy SignalsI created this Forex buy signal indicator to save myself some time when looking for buy opportunities. The signals are generated from a combination of several indicators such as the RSI, MACD, Wave Oscillator etc. I spent alot of time tweaking all the values to give me reliable signals. I trade one hour candles and generally get 50+ pips per signal.
If price goes down after the first signal and I get another signal, I buy again which means I get a average buy price (dollar cost average) and then sell when it reaches my profit level.
Alerts are built-in as well. The indicator does repaint at the moment so set the alert to "on candle close" to ensure that you get a valid signal. Longer timeframes works better and as mentioned I use 1 hour candle.
I will release the back-test of this indicator shortly where you can then enter your capital amount and set profit & stop loss levels to see how you would have performed based on historical data.
The current version is free and I will grant access on request.
Comments & suggestions welcome.

Dolor Aqua v1.0 http://tvautotrader.comBased on my old indicator which had a great opportunity to detect the perfect bottom to start a long trade.
This strategy is using open candle values so it doesn't repaint trade signals!
The receipt is a mix of classic indicators like RSI, MACD, moving averanges, money flows and s/r borders. On different timeframes have different profit chance (65-90%) and big p. ratio
Compatible with TradingView Auto-Trader Bot
tvautotrader.com
